

It is essential to have an invasive species list because these invaders create $120 billion in damages per year across our ecosystems. They upset natural balances and put native animals at risk. In the United States, 42 percent of endangered species are directly threatened by these aggressive newcomers. These are organisms that are not originally from these environments and that harm the environments that they invade.
Throughout my time conducting fieldwork in Louisiana, I have witnessed the destruction of wetlands caused by nutria. Invasive species can often be recognized by their rapid spread and the damage they inflict on native plants. This guide will give you some of the fundamental tools needed to identify these threats. Your knowledge will help you protect at-risk habitats from irreversible damage.
Defining Invasive Species
An invasive species can be identified through two rigid parameters: it must be non-native to the ecosystem and must also produce documented damages. An example are the Burmese Pythons in Florida. They came over from Southeast Asia and are currently decimating mammal populations that are native to Florida. The same is true for Zebra Mussels, which clog water infrastructure and are outcompeting local shellfish.
Invasive species are often mistakenly identified as aggressive natives or vice versa. White-tailed deer, for instance, are a native, common species that can lead to some problems if they lose their natural predator. However, the invasive species, Japanese Knotweed, is functionally different from native species. Japanese Knotweed is an invasive organism from a foreign area that lacks a natural predator to keep it in check. The USDA guidelines classify invasive organisms and require information on foreign native, and measurable ecological damage.
I have personally experienced the difference while doing fieldwork in the Everglades. Native species adapt to living in food webs that are not disturbed. Invasive species, such as the Python, can permanently disturb ecosystems. The invasive will have tremendous growth in population, and its presence creates unalterable conditions. Hence, prompt and early detection of invasive species is vital for protecting ecosystems.
To determine if an organism is a true invasive species, it is necessary to verify its origin and its impact. Answer these two questions: Did the organism arrive as a result of human activities? Does it cause harm to biodiversity or human-built systems? If you can answer "Y" in both questions, the organism is another invasive species that requires intervention.
Non-Native Origin
- Definition: Species introduced outside natural range through human activity
- Example: Burmese Python from Southeast Asia in Florida Everglades
- Verification: USDA records show first sightings in 1979 via pet trade
- Exclusion: White-tailed deer population surges are native disturbances
Rapid Reproduction
- Definition: Self-sustaining populations without human intervention
- Example: Zebra Mussels produce 1 million offspring annually per female
- Impact: Colonized Great Lakes within 5 years of 1988 introduction
- Threshold: Population doubling in under 3 years qualifies as invasive
Documented Harm
- Definition: Measurable ecological or economic damage exceeding native species
- Example: Kudzu overgrowth costs $500M/year in control and crop losses
- Evidence: USDA reports show smothered 7 million acres of southeastern forests
- Verification: Requires peer-reviewed studies confirming impact severity
Geographic Spread
- Definition: Ability to colonize diverse habitats beyond introduction site
- Example: Emerald Ash Borer spread to 35 states in 20 years
- Impact: Caused regional extinction of ash trees in Midwest
- Verification: USDA quarantine maps show exponential expansion
Regulatory Status
- Definition: Legal classification as invasive by government agencies
- Example: Federal Noxious Weed List prohibits Giant Salvinia transport
- Evidence: 312 IAC 18-2-23 bans 12 aquatic plants in Indiana
- Importance: Violations incur fines up to $10,000 per incident
Aquatic and Terrestrial Invaders
Aquatic invaders exemplified by Zebra Mussels can be incredibly damaging. Zebra Mussels filter a liter of water each day, clogging pipes, resulting in $1 billion in infrastructure repairs. At the same time, Asian Carp can jump as high as 10 feet, dominating rivers across 28 states. Likewise, invasive plants such as Hydrilla grow as much as one inch every day and form dense mats that block out sunlight completely. It is essential to note that Water Hyacinths can double their coverage every two weeks, suffocating fish in the process.
Across land, Burmese pythons have decimated the raccoon population in the Everglades by 99 percent. Feral swine root up from 2 to 8 acres nightly, costing agriculture $2.5 billion a year. Japanese Knotweed grows stems resembling bamboo that can crack foundations, resulting in $2.8 billion in damage. I've seen entire forests smothered in Kudzu vines that can grow a foot per day in summer.
Both of these habitats face threats that are microscopic in size. New Zealand Mud Snails are capable of cloning themselves 430 times a year and reaching 500,000 snails per square meter. The Chytrid fungus has caused the extinction of approximately 90 species of frogs worldwide. Early detection is important. Unusual species can be reported through the USDA process to help protect the local ecosystem from invasive species.
Freshwater Animals
- Zebra Mussel: Filters 1 liter/day (0.26 gallons/day), causes $1B/year infrastructure damage by clogging pipes
- Asian Carp: Leaps 10 ft (3 m) high, dominates river ecosystems across 28 states consuming native fish eggs
- New Zealand Mud Snail: Produces 430+ clones annually, outcompetes native snails in western river systems
- Quagga Mussel: Colonizes depths to 400 ft (130 m), alters water quality by filtering plankton excessively
- Snakehead Fish: Survives 4 days on land, spreads between watersheds during flood events
Marine Intruders
- Lionfish: Venomous spines deter predators, consumes over 50 fish species in Caribbean coral reef habitats
- European Green Crab: Destroys 6.5 sq miles (16.8 sq km) of seagrass annually by uprooting vegetation
- Asian Shore Crab: Tolerates temperatures from 23-95°F (-5-35°C), alters tidal zone biodiversity significantly
- Caulerpa Taxifolia: Smothers 100% of native seafloor life, called 'killer algae' for rapid colonization
- Veined Rapa Whelk: Consumes 50 oysters daily, threatens commercial shellfish industries along coastlines
Aquatic Plants
- Hydrilla: Grows 1 inch/day (2.5 cm/day), forms dense surface mats blocking sunlight penetration completely
- Water Hyacinth: Doubles coverage in two weeks, reduces oxygen levels below survival thresholds for fish
- Eurasian Watermilfoil: Creates stagnant conditions with dissolved oxygen below 5 mg/L killing aquatic life
- Giant Salvinia: Forms 3 ft (1 m) thick mats, makes waterways impassable for boats and recreation
- Curly-Leaf Pondweed: Dies off in summer, decomposes while consuming dissolved oxygen needed by fish
Coastal Invaders
- Nutria: Erodes 1 acre (0.4 ha) of marshland per five individuals annually through burrowing activities
- Phragmites: Forms 15 ft (4.5 m) tall monocultures, displaces native wetland plants across shorelines
- Saltcedar: Consumes 200 gallons (757 liters) of water daily per tree, desiccates riparian habitats
- Spartina Grass: Alters tidal flows, reduces habitat for migratory shorebirds and juvenile fish
- Chinese Mitten Crab: Migrates 100 miles (160 km) upstream annually, damages fishing nets with sharp claws
Microscopic Threats
- New Zealand Mud Snail: Reproduces asexually, achieves densities of 500,000 individuals per square meter
- Spiny Water Flea: Clogs fishing lines, competes with juvenile fish for microscopic plankton resources
- Quagga Mussel Larvae: Transports via boat bilge water, establishes colonies within weeks of introduction
- Didymo Algae: Creates thick brown mats, smothers river bottoms across cold water ecosystems globally
- Chytrid Fungus: Kills amphibians by disrupting skin function, responsible for 90+ frog extinctions
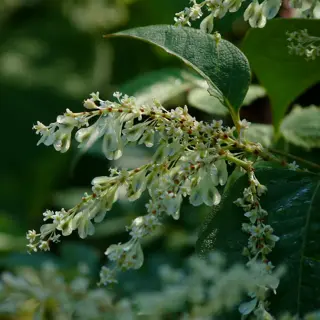
Japanese Knotweed
- Growth Pattern: Bamboo-like stems reach 10 ft (3 m) height within a single growing season rapidly
- Structural Damage: Powerful roots crack concrete foundations, costing $2.8B/year in building repairs
- Reproduction: Root fragments regenerate new plants within 6 days, spreading 130 ft (40 m) laterally
- Control Challenges: Requires professional removal since any remaining fragments guarantee regrowth
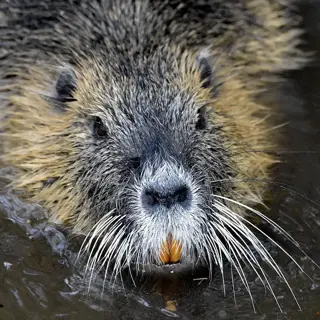
Nutria
- Feeding Impact: Consumes 25% body weight daily, eroding 1 acre (0.4 ha) of marsh per five individuals
- Reproduction Rate: Produces three litters annually with 12 young each, enabling 200% population growth
- Geographic Spread: Colonized 15 states from Gulf Coast to Pacific Northwest in three decades
- Burrowing Effects: Weakens levees and irrigation systems through extensive tunnel network construction
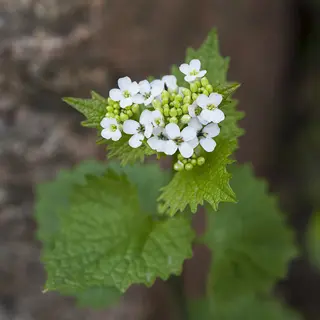
Garlic Mustard
- Chemical Warfare: Releases allelopathic toxins killing native tree seedlings within root zones
- Seed Production: Single plant produces 8,000 seeds remaining viable for 10 years in forest soil
- Control Window: Must be hand-pulled before seed set during May-June for effective management
- Ecological Impact: Eliminates native spring wildflowers like trillium and bloodroot within five years
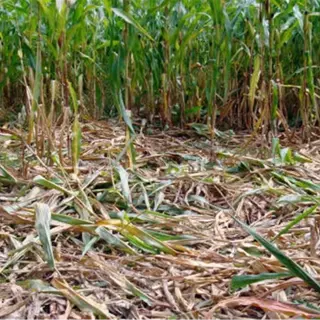
Feral Swine
- Economic Impact: Causes $2.5 billion/year losses to agriculture through crop destruction and predation
- Reproduction: Two litters annually yield 6-12 piglets each, doubling populations every 4 months
- Disease Vectors: Carries 30+ pathogens including pseudorabies and brucellosis transmissible to livestock
- Foraging Damage: Roots up 2-8 acres (0.8-3.2 ha) nightly searching for insects and plant material
Emerald Ash Borer
- Tree Mortality: Killed over 100 million ash trees across 35 states since 2002 North American introduction
- Spread Mechanism: Travels 20-40 miles (32-64 km) yearly through human firewood transportation
- Identification Signs: Creates distinctive D-shaped exit holes and serpentine larval galleries under bark
- Ecological Cost: Eliminates ash canopy cover critical for urban cooling and wildlife habitat provision
Kudzu Vine
- Growth Rate: Expands 1 foot (0.3 m) daily during summer, smothering entire forests and structures
- Economic Cost: Requires $500 million/year for control across 7 million southeastern infested acres
- Spread Method: Root nodes establish new plants wherever stems contact soil, enabling rapid colonization
- Historical Context: Introduced from Asia in 1876 for erosion control before becoming invasive nuisance
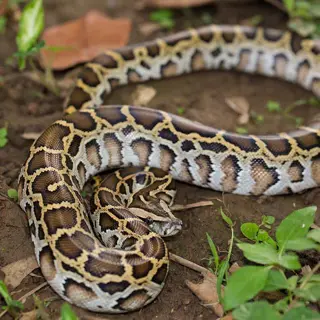
Burmese Python
- Predatory Impact: Consumes mammals up to deer size, reducing raccoon populations by 99% in Everglades
- Reproduction: Lays 50-100 eggs annually, surviving winter temperatures down to 40°F (4.4°C)
- Control Efforts: Professional hunters remove 5,000+ snakes yearly from Florida's southern wetlands
- Introduction Origin: Released pets established breeding populations after 1992 Hurricane Andrew
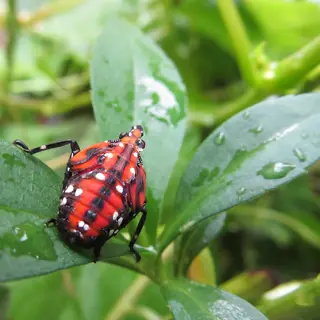
Spotted Lanternfly
- Crop Damage: Feeds on 70+ plant species including grapes, apples, and hardwood timber trees
- Honeydew Production: Excretes sticky residue promoting sooty mold that kills host plants gradually
- Spread Prevention: Quarantines restrict movement of materials from 17 affected eastern US states
- Lifecycle: Lays 30-50 egg masses annually on any smooth surface including vehicles and outdoor gear
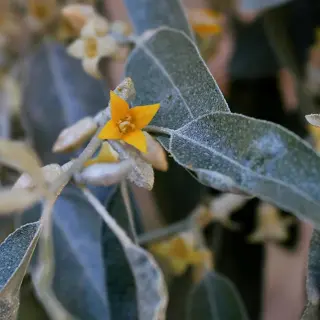
Russian Olive
- Water Consumption: Single tree uses 75 gallons (284 liters) daily, drying riparian zones completely
- Seed Dispersal: Birds spread seeds 10+ miles (16+ km) from parent plants along river corridors
- Thorn Hazards: Sharp spines injure livestock and wildlife attempting to browse on foliage or fruit
- Control Methods: Requires combined cutting and herbicide application to prevent stump resprouting
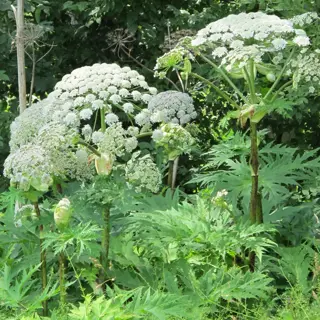
Giant Hogweed
- Toxic Sap: Causes severe phytophotodermatitis with third-degree burns and permanent sunlight sensitivity
- Height: Grows 15 ft (4.5 m) tall with 5 ft (1.5 m) wide leaves shading out native vegetation
- Seed Production: Single flower head yields 20,000 seeds remaining viable for 10 years in soil banks
- Public Safety: Requires hazmat-suited removal teams due to dangerous sap exposure risks during work
United States Federal and State Lists
Federal regulations, such as the Federal Noxious Weed Act, prohibit risk species, including Giant Hogweed and Mediterranean Caper. APHIS-USDA works in partnership with inspectors to enforce these regulations at 350 ports. Fines can reach up to $50,000 for transporting prohibited plants across state lines. This system is designed to prevent the introduction of risk species, whether intentionally or through negligence. I've seen inspectors stop contaminated nursery stock myself.
Methods can differ dramatically in their classification methodologies and enforcement. For example, California's CDFA is working to address the Yellow Starthistle, which is choking out native plants and grasslands. In Florida, FDACS is dealing with Brazilian Pepper trees invading wetlands, while TPWD in Texas is combating Saltcedar trees that are sucking up the water. Indiana's DNR addresses the Garlic Mustard invading forests. Each state has responded to the local threat in a specific manner.
It is important to understand the differences in classification. Prohibited species, for example, the Melaleuca trees in Florida, cannot be possessed. Restricted species, like California's Pampas grass, require containment. Noxious weeds, such as King Ranch Bluestem from Texas, can require an entire control program to manage them. These level classifications define the legal expectations of residents and businesses.
Public reporting of sightings to USDA systems supports these efforts. I have learned through my work as a conservation professional that public alerts to an invasive species generally result in rapid action by my State in addressing that species. Before relocating any plants, animals, or insects from one place to another, ensure you check the proper lists. The more that you pay attention, the less likely a new invasion will occur.
Federal Noxious Weeds
- Legal Basis: Prohibited under Federal Noxious Weed Act of 1974
- Examples: Giant Hogweed, Yellow Toadflax, Mediterranean Caulerpa
- Enforcement: USDA-APHIS restricts importation and interstate transport
- Penalties: Fines up to $50,000 (≈€46,000) for violations involving prohibited species
- Scope: Covers 112 plant species with high invasion potential nationwide
Prohibited Aquatic Plants
- Regulation: Federal code 312 IAC 18-2-23 bans 12 high-threat species
- Examples: Eurasian Watermilfoil, Hydrilla, Water Hyacinth
- Control: Mandatory removal from boats at 650+ inspection stations
- Impact: Prevents spread through Great Lakes and Mississippi watersheds
- Compliance: 85% reduction in infestations at federal reservoirs since 2015
USDA-APHIS Priority Pests
- Criteria: Species with potential for catastrophic agricultural damage
- Examples: Asian Citrus Psyllid, Spotted Lanternfly, Khapra Beetle
- Quarantines: 37 active federal quarantines across 28 states
- Monitoring: 350+ USDA inspection stations at ports nationwide
- Detection: 1,200+ interceptions annually at US ports of entry
Endangered Species Act Conflicts
- Challenge: Invasives threaten 42% of federally listed endangered species
- Example: Feral pigs destroy habitats of Red Wolf in North Carolina
- Mitigation: $15M/year allocated for invasive control in protected areas
- Legal Mandate: ESA Section 7 requires federal agencies to control threats
- Success: Removal of goats restored habitat for Hawaiian Petrel on Maui
Lacey Act Enforcement
- Prohibition: Bans interstate transport of harmful species without permit
- Scope: Covers 1,800+ species including Burmese Python and Zebra Mussel
- Penalties: Civil fines up to $10,000 (≈€9,200) per violation
- Cases: 120+ prosecutions annually for illegal wildlife trafficking
- Prevention: Mandatory declarations for imported plants and animals
Prohibited Species
- Definition: Illegal to possess, transport, or sell
- Enforcement: Immediate removal required with penalties
- Example: Florida bans 27 plants including Brazilian Pepper
- Reporting: State hotlines (e.g., 1-888-EXOTIC-FL)
- Fines: Up to $5,000 (≈€4,600) per violation
Restricted Species
- Definition: Limited possession with containment requirements
- Conditions: Must prevent flowering/spread in controlled settings
- Example: California allows nursery sales of Pampas Grass with warnings
- Documentation: Mandatory sales records in 15 states
- Area Limits: Max 0.25 acre (0.1 ha) cultivation plots
Noxious Weeds
- Definition: Targeted for eradication but not fully prohibited
- Management: State-led control programs with landowner cooperation
- Example: Texas mandates control of King Ranch Bluestem on public lands
- Funding: USDA cost-sharing for 40-60% of control expenses
- Timeline: 5-year eradication plans for high-priority species
Watch List Species
- Definition: Emerging threats not yet established in state
- Monitoring: Citizen science reporting via apps like EDDMapS
- Example: Spotted Lanternfly on watch lists in 14 western states
- Response: Rapid response teams deploy within 72 hours of sightings
- Prevention: Public education campaigns at 200+ events annually
County-Level Regulations
- Authority: Supplemental to state laws in high-risk areas
- Examples: King County (WA) bans English Ivy within urban zones
- Enforcement: Local weed control boards with inspection powers
- Penalties: $500-$1,000 (≈€460-920) for non-compliance
- Effectiveness: 30% faster containment than state-only programs
Global Invasive Species Database
The IUCN Global Invasive Species Database monitors and maintains records on more than 1,200 invasive species with a high risk of threat level and includes extensive detailed profiles. As a researcher, I have utilized the risk assessments in this database to make predictions of the spread of Asian Carp into the Mississippi Basin. The database, which is free and publicly available, publishes distribution maps for each species as well as management case studies. The database is updated quarterly and routinely incorporates data from across 200 countries worldwide, making it an invaluable resource for evidence-based conservation work.
EASIN for Europe & NISbase for Japan are regional databases that specifically address local threats. EASIN tracks approximately 15,000 alien species with near real-time alerts. At the same time, NISbase assesses and models biological range shifts under various climate change scenarios. As these databases address domestic systems with different local vulnerabilities, they also help address regional vulnerabilities, such as the invasion of Miconia in Hawaii. In my work with Okinawa, NISbase was used to identify the arrival of new crab species.
The economic consequences are immense, with the Water Hyacinth responsible for asset losses exceeding $200 million in fisheries across Africa. Ecologically, Cane Toads alone drove 30 of Australia's marsupials to extinction, and Climate change will only exacerbate these risks. I can also confirm that I've already observed and documented pythons expanding their range north as temperatures increase. Databases now incorporate IPCC projections of potential ranges for high-risk species in 2050.
Global Invasive Species Database (GISD)
- Managed By: IUCN Invasive Species Specialist Group
- Coverage: 1,200+ species profiles with distribution maps
- Features: Risk assessments, introduction pathways, management case studies
- Update Frequency: Quarterly additions from 200+ country reports
- Access: Free public portal at iucngisd.org
CABI Invasive Species Compendium
- Scope: 2,400+ detailed species datasheets with images
- Specialization: Agricultural and forestry pests with economic impact data
- Tools: Predictive distribution modeling under climate scenarios
- Partnerships: Data sharing with 50+ national agricultural agencies
- Languages: Available in English, Spanish, French, Chinese
European Alien Species Information Network (EASIN)
- Coverage: 15,000+ alien species in European territories
- Mapping: Real-time distribution tracking with citizen science input
- Alert System: Flags new arrivals within 72 hours of verification
- Regulatory Support: Directly feeds EU invasive species regulation
- Integration: Links to 28 national databases across Europe
NISbase (Japan)
- Focus: 800+ invasive species in Asian-Pacific ecosystems
- Features: Damage assessment tools for forestry and fisheries
- Climate Modeling: Projects range shifts under 2°C/4°C warming scenarios
- Endemism Protection: Prioritizes threats to 150+ endemic species
- Mobile App: Field identification tool with offline capability
Global Register of Introduced Species (GRIS)
- Initiative: UN-backed platform aggregating national databases
- Coverage: 35,000+ introduced species across 200 countries
- Verification: Expert-validated records with error reporting system
- Policy Tools: SDG alignment metrics for biodiversity targets
- Access: API integration for government and research institutions
Research Applications
- Predictive Modeling: Project range expansion using climate datasets
- Impact Studies: Quantify biodiversity loss with IUCN Red List integrations
- Genetic Analysis: Trace invasion routes with DNA barcode libraries
- Policy Development: Inform national invasive species strategies
- Education: Curriculum modules for 500+ universities globally
Government Implementation
- Border Control: Screening protocols at 1,200+ international ports
- Early Detection: Drone surveillance programs in high-risk ecosystems
- Quarantine Designation: GIS-based restricted zones updated monthly
- Funding Allocation: Priority ranking for $2B/year control programs
- Treaty Compliance: Reporting for CBD Aichi Targets
Public Participation
- Citizen Science: EDDMapS app with 5M+ user submissions annually
- Identification Tools: AI-powered image recognition for 3,000+ species
- Reporting Channels: National hotlines and online verification portals
- Community Projects: 1,000+ local removal initiatives worldwide
- Education: K-12 invasive species curricula in 30 countries
Corporate Applications
- Supply Chain Screening: Prevent contamination in agricultural imports
- Infrastructure Protection: Water intake design against mussel fouling
- Biosecurity Certification: ISO-compliant invasive species management
- Ecological Compensation: Habitat restoration investment calculators
- Risk Assessment: Insurance models for invasive-related damages
Climate Change Integration
- Range Shift Models: IPCC scenario projections for 2050/2100
- Vulnerability Index: Hotspot mapping for protected areas
- Adaptation Planning: Assisted migration guidelines for endemics
- Carbon Impact: Invasives alter 15% global carbon sequestration
- Funding Mechanisms: Green bonds for climate-resilient biosecurity
Pathways and Prevention
Invasive species enter the country through numerous intentional pathways (e.g., the introduction of ornamental plants) and accidental pathways (e.g., the release of ballast water), according to data from the USDA The horticulture trade accounts for 65% of invasions. I have found contaminated nursery stock with insects during the inspections of imported plants. Another significant pathway is through global shipping, as vessels transport 10,000 species per day in ballast tanks.
Preventing invasive species will require the action of different groups. Homeowners should work to establish native alternatives to plant instead of invasive ornamentals. Boaters should Clean - Drain - Dry any equipment used for the water between water bodies. Pet owners should consider surrender programs to find homes for unwanted pets instead of releasing them. I have seen invasions of Burmese Pythons start from pets that were released in neighborhoods in Florida.
It is essential to report sightings using USDA systems, such as the EDDMapS app and SITC hotline, as this facilitates a rapid response, as seen in the case of Asian Giant Hornet (AGH) sightings in Washington State, for example. In my work in the field of conservation, public reports helped intercept boats contaminated with Zebra Mussels. Early detection can mitigate problems before irreversible damage is inflicted on an ecosystem.
Horticulture Trade
- Mechanism: Imported nursery stock carrying seeds or insects
- Example: Japanese Barberry introduced as ornamental plant in 1875
- Scale: 65% of invasive plants entered via horticulture
- Prevention: USDA APHIS certification for pest-free stock
- Compliance: Mandatory inspection at 350+ US ports
Ballast Water Discharge
- Mechanism: Ships transporting organisms between ports
- Example: Zebra Mussels introduced to Great Lakes in 1988
- Scale: 10,000+ species transported globally each day
- Regulation: IMO Ballast Water Management Convention
- Technology: UV treatment systems eliminate 99.9% organisms
Pet and Aquarium Releases
- Mechanism: Owners releasing unwanted pets into wild
- Example: Burmese Python established in Everglades post-1992
- Scale: 200+ invasive species traced to pet releases
- Solutions: Surrender programs at 1,000+ zoos/pet stores
- Legislation: Lacey Act prohibits interstate transport
Contaminated Equipment
- Mechanism: Seeds/eggs hitchhiking on vehicles or gear
- Example: Eurasian Watermilfoil spread via boat trailers
- Scale: 80% of lakes infected by recreational boating
- Protocols: Clean-Drain-Dry mandates at water access points
- Enforcement: $500 fines for non-compliance in 28 states
Timber and Packaging
- Mechanism: Wood borers in shipping pallets/crates
- Example: Emerald Ash Borer arrived in Michigan 2002
- Standard: ISPM 15 heat-treats all international wood
- Inspection: USDA intercepts 15,000+ infested shipments/year
- Innovation: Plastic pallets replacing wood in global trade
Early Detection Systems
- Network: Sentinel plant nurseries monitoring for pests
- Technology: eDNA water sampling detects invaders at 1ppm
- Coverage: 5,000+ monitoring sites across US ecosystems
- Response: Rapid strike teams deploy within 24 hours
- Success: Caught Asian Giant Hornet in Washington 2020
Public Awareness Campaigns
- Programs: National Invasive Species Awareness Month
- Tools: MISIN app identifies 3,000+ species with 90% accuracy
- Reporting: 1-877-STOP-ANS hotline for sightings
- Engagement: 50,000+ volunteers in removal projects
- Impact: 30% increase in public reporting since 2020
Border Protection Measures
- Screening: X-ray and detector dogs at 328 ports
- Interceptions: 4.7M prohibited items seized annually
- Database: AQI (Agricultural Quarantine Inspection) system
- Training: 2,500 CBP officers certified in species ID
- Technology: Automated risk assessment algorithms
Pathway Risk Analysis
- Methodology: USDA Pathway Risk Analysis framework
- Focus: Prioritizes vectors with >5% invasion probability
- Output: Targeted quarantine zones for high-risk imports
- Update: Annual reassessment based on new data
- Application: Restricted firewood movement in 30 states
Research Initiatives
- Focus: Pathway interruption technologies
- Projects: CRISPR gene drives for invasive mosquitoes
- Funding: $50M/year USDA grants for prevention science
- Partnerships: 120 university research programs
- Innovation: Drone-mounted herbicide precision spraying
5 Common Myths
Only non-native species can be invasive and cause damage to ecosystems.
Native species can be invasive in nature when the ecosystem is not balanced, for example white-tailed deer that have overpopulated deer due to the extinction of wolves, consume native seedlings and may even prevent forest regeneration altogether, which is evident across 15 million acres in eastern United States states.
Exotic species always show immediately and their presence is easily recognizable early in the encounter.
Many invasive species spread silently for years without anyone realizing they were spreading (like soil-borne Chytrid fungus causing global amphibian extinctions, or small New Zealand Mud Snails that were colonizing rivers unnoticed, until reaching critical densities of 500,000 individuals per square meter, completely destroying the ecosystems).
When invasive species establish in an area, total eradication is not feasible.
Early detection programs effectively removed Mediterranean Fruit Fly from California utilizing quarantines and targeted pesticides and coordinated efforts successfully removed invasive goats from 120 islands world-wide, restoring habitat for endangered species such as the Hawaiian Petrel.
Invasive species primarily threaten agricultural areas rather than natural ecosystems and parks.
Over 60% of invasive species damage occurs in natural areas, with examples including Emerald Ash Borer destroying 100 million trees in forests and parks, and feral pigs degrading 80,000 acres annually in national parks like Great Smoky Mountains.
No single action makes much impact in the mitigation of invasive species movement.
Reporting by the public by apps like EDDMapS has enabled approximately 30% of successes in containment, such as early detections of spotted lanternfly followed by efforts which resulted in quarantines across 17 states, or boat inspection stations which found 45% less spread of zebra mussels in the Great Lakes region.
Conclusion
Invasive species invade every ecosystem, from backyard gardens to national parks, with a significant presence in nearly every ecosystem. Their effects are direct and often substantial, with threats to native biodiversity throughout communities. Prevention is cost-effective, estimated to save states and local governments $120 billion a year compared to future eradication efforts. This is not only beneficial for the accessibility and sustainable management of natural resources, but also for local economies.
Your actions have a quantifiable impact, as demonstrated by the numbers supporting numerous conservation success stories. Public reporting through tools such as EDDMapS has affected 30% of all containment victories throughout the country. During my fieldwork, I had the opportunity to document how citizen reporting halted the spread of the Spotted Lanternfly in Pennsylvania. These frontline defense systems empower communities to defend against invasive species.
As a reminder, invasive species management begins with awareness. When you use native alternatives in your gardens or clean your boat between lakes, you are helping to preserve ecosystems. Different case studies on invasive species management in New Zealand and the Great Lakes tell a similar story of how nurturing ecosystems in aggregate can result from individual decisions made in small increments. Your behavior today advocates against the potential ecological disaster of tomorrow.
External Sources
Frequently Asked Questions
What defines an invasive species?
Invasive species are non-native organisms that cause ecological or economic harm. Key criteria include rapid reproduction, documented damage exceeding native species, and ability to spread beyond introduction sites. Examples range from Zebra Mussels clogging infrastructure to Burmese Pythons disrupting food chains.
Which US states face severe invasive species problems?
Florida, California, and Hawaii have critical invasive species issues due to climate and trade routes:
- Florida: Burmese Pythons and Brazilian Pepper trees
- California: Yellow Starthistle choking native plants
- Hawaii: Coqui Frogs disrupting island ecosystems
What are the most destructive aquatic invasive species?
High-impact aquatic invaders include:
- Zebra Mussels: Clog pipes and outcompete natives
- Water Hyacinth: Suffocates waterways by doubling coverage every two weeks
- Asian Carp: Leaps from water, injuring boaters and dominating ecosystems
How do invasive species enter new environments?
Primary pathways include horticulture trade carrying contaminated plants, ballast water discharge from ships transporting organisms, pet releases, and equipment like boats spreading eggs. USDA reports 65% of invasions start through commercial horticulture imports.
What government agencies regulate invasive species?
Key regulatory bodies include:
- USDA-APHIS: Federal oversight with 350+ inspection ports
- State DNRs: Enforce local bans (e.g., Indiana's aquatic plant restrictions)
- IMO: Global ballast water standards for shipping
Can native species become invasive?
Yes, native species like white-tailed deer become invasive when ecosystems are unbalanced. Without natural predators, they overgraze forests, preventing tree regeneration across millions of acres. This demonstrates that invasion status depends on environmental context, not just origin.
What global databases track invasive species?
Major databases include IUCN's Global Invasive Species Database (1,200+ species profiles), CABI Compendium (2,400+ agricultural pests), and UN's Global Register (35,000+ species). These provide distribution maps, risk assessments, and real-time alerts for new invasions.
How can individuals prevent invasive species spread?
Critical actions:
- Boaters: Clean-Drain-Dry equipment between waterways
- Gardeners: Plant native species instead of ornamentals like Japanese Barberry
- Pet Owners: Use surrender programs, never release animals
- Travelers: Declare agricultural items at borders
What's the economic cost of invasive species?
Invasives cost over $120 billion annually in damages and control. Examples include $1 billion for Zebra Mussel infrastructure repairs, $2.5 billion from feral swine crop destruction, and $500 million for Kudzu vine management across 7 million acres.
Are there successful invasive species eradication cases?
Yes, early detection programs eliminated Mediterranean Fruit Flies from California through quarantines. Island ecosystems were restored by removing invasive goats, saving species like the Hawaiian Petrel. These successes highlight prevention's cost-effectiveness versus long-term management.